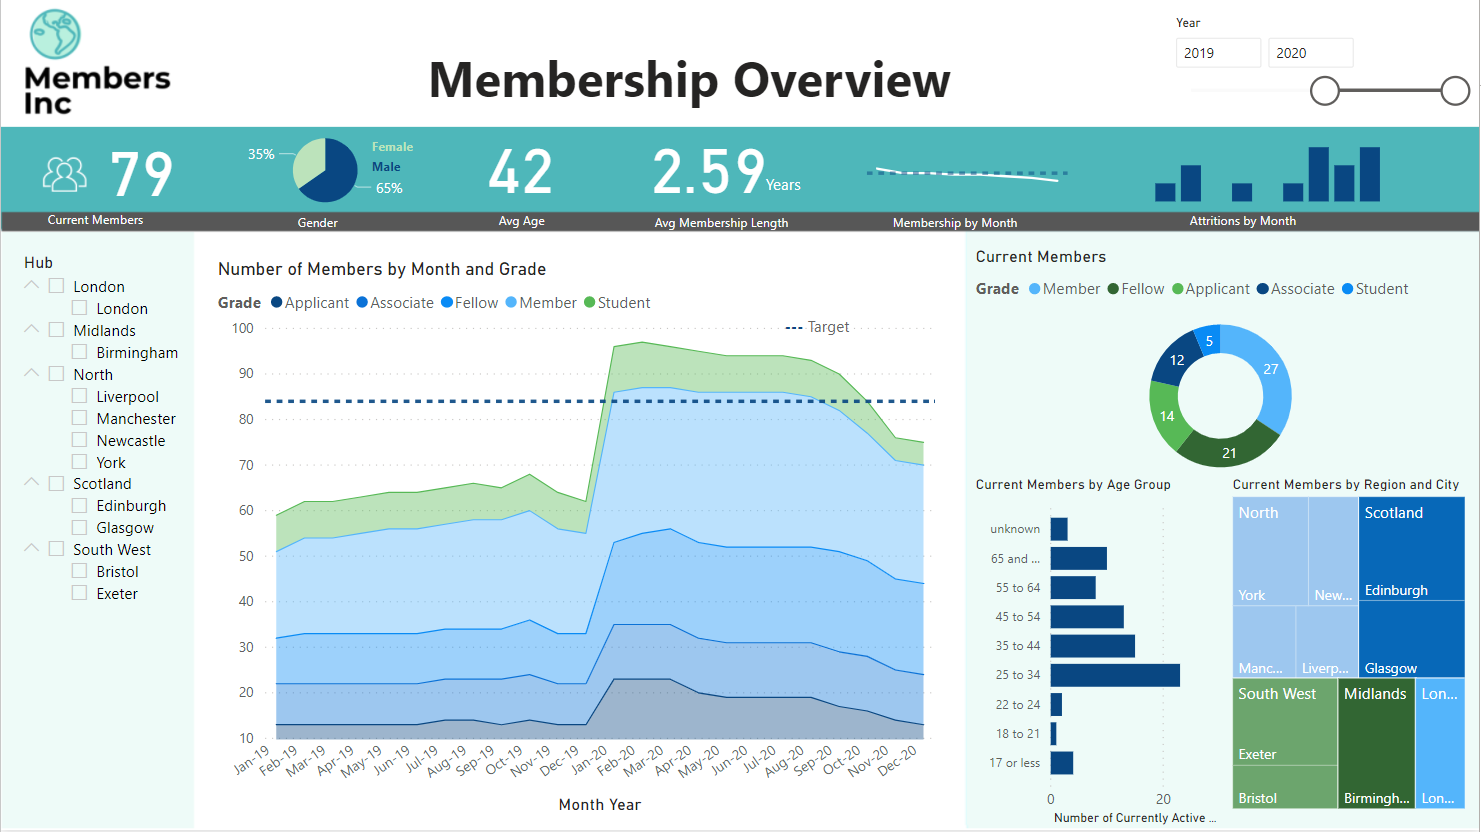
Making the most of your membership data with visualisation
Optimizing data visualization is essential for understanding your membership base
Optimizing data visualization is a key aspect of understanding your membership base because it allows you to present complex information in clear and insightful ways.
Here are several reasons why getting your hands on the right visualisation tools is a great idea!
- Enhances Comprehension: Data visualizations, such as charts, graphs, and infographics, provide a visual representation of data patterns and trends. They make it easier for both analysts and non-technical stakeholders to grasp the insights hidden within the data, enabling better comprehension of your membership base's characteristics, behaviours, and preferences.
- Identifies Patterns and Trends: Effective data visualizations highlight patterns, correlations, and trends that might be difficult to discern from raw data alone. By identifying these patterns, you can gain valuable insights into your membership base's behaviour, enabling you to make data-driven decisions.
- Facilitates Data Exploration: Interactive data visualizations allow users to explore the data from different angles, filter information, and drill down into specific details. This exploration capability helps discover new relationships and answers to specific questions related to your membership base.
- Supports Decision-Making: When dealing with a membership base, organizations often need to make critical decisions regarding marketing strategies, product offerings, or member engagement. Well-designed data visualizations provide decision-makers with relevant and actionable information, making the decision-making process more efficient and effective.
- Improves Communication: Data visualizations are a powerful tool for communicating insights to stakeholders. Whether it's presenting findings to executives, team members, or external partners, visualizations can effectively convey complex information in a concise and understandable way, fostering more informed discussions and collaborations.
- Detects Anomalies and Outliers: Data visualizations can help detect outliers or anomalies within your membership base data, which might indicate potential issues or opportunities. Identifying these outliers can lead to further investigation and a better understanding of the factors affecting your members.
- Monitors Key Performance Indicators (KPIs): Data visualizations enable the tracking and monitoring of key performance indicators that are essential for evaluating the success of your membership programs or initiatives. This ongoing monitoring helps ensure that you stay on track to achieve your organizational goals.
- Promotes Data-Driven Culture: By optimizing data visualization, you encourage a data-driven culture within your organization. When data is presented in a visually appealing and understandable way, it becomes more accessible and encourages data-driven decision-making at all levels.
In summary, optimizing data visualization is essential for understanding your membership base because it simplifies complex data, uncovers insights, facilitates exploration, supports decision-making, and promotes a data-driven approach to managing and engaging with your members. It ultimately leads to better-informed strategies and actions, resulting in improved member satisfaction and organizational success.
At PTR we are obsessed with this stuff! We love to help you get the best from your data and we have access to some of the coolest tools. Contact us here for a chat …
Membership organisations face unique challenges when it comes to tracking membership statistics and engagement levels to determine the best course for future business strategy. We have encountered most of those challenges and found a way to build an integrated and powerful business model, from which engaging, interactive dashboards can then be developed.
Take a read of this article to find out how you can achieve a full member view with Business Intelligence: Data Analytics For Membership Organisations. Or contact Keith Doward at info@ptr.co.uk or on 0118 979 4000 for more in formation about how PTR can help.